1 The data science mindset
1.1 CLARA
Each person has their own learning preferences and habits of mind that shape their response to challenges and learning opportunities.
CLARA (Crick LeArning for Resilient Agency) is a tool used to prompt reflection on a multidimensional construct called “Learning Power” with eight dimensions: curiosity, creativity, sense making, belonging, collaboration, hope and optimism, mindful agency and openness to change. The UTS Graduate Attributes have a strong resonance with these dimensions. The CLARA tool is used as part of MDSI activities, aiming to help the students maximise their development results through understanding themselves better, namely with regards to their approach to learning and challenges.
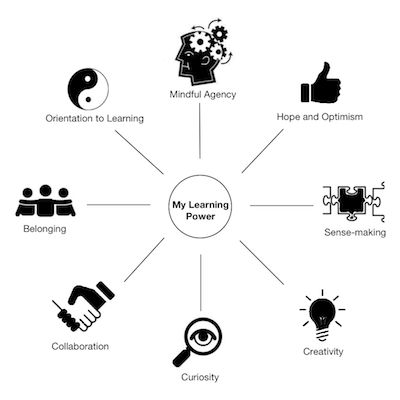
The tool is survey-based and provides a profile-style feedback covering each of the following dimensions:
Curiosity
- Wanting to get beneath the surface & find out more
- Always wondering why and how
Creativity
- Using my intuition & imagination to generate new ideas & knowledge
- Taking risks & playing with ideas and artefacts to arrive at new solutions
Sense making
- Making connections between what I already know & new information & experience
- Making meaning by linking my story, my new learning & my purpose
Belonging
- Being part of a learning community at work, at home, in education & in my social networks
- Knowing I have social resources to draw on when I need them
Collaboration
- Being able to work with others, to collaborate and co-generate new ideas and artefacts
- Being able to listen and contribute productively to a team
Hope and optimism
- Having the optimism & hope that I can learn & achieve over time
- Having a growth mindset; believing I can generate my own new knowledge for what I need to achieve Mindful agency
- Taking responsibility for my own learning over time through defining my purposes, understanding and managing my feelings,
- Knowing how I go about learning & planning my learning journey carefully Openness to change
- An emotional orientation of being open & ready to invest in learning, having flexible self-belief, willing to persist & manage any self-doubt
- A necessary prerequisite for developing resilience in learning
Here is an example of an output from CLARA, showing the resulting profile, based on the responses provided in the survey.
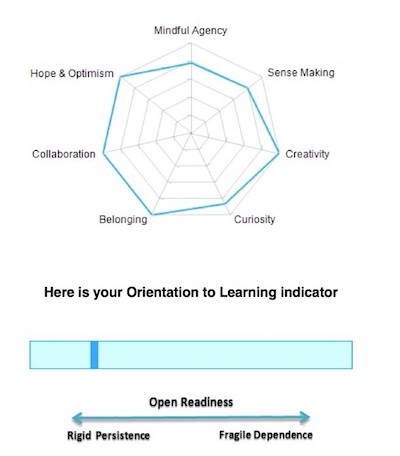
Learning profiles can change over time, so MDSI conducts two sets of CLARA tests, to allow the students to compare their profile changes and reflect on their development progress.
CLARA survey will be organised by MDSI and each student will receive a link and instructions on how to utilise this tool.
1.2 Data Science Professional Competencies
Competency can be defined as “effective application of skill, knowledge and abilities to on-the-job-behaviour and capability to perform to job requirements”. MDSI supports the ongoing development professional development efforts and offers a tool that can help the students evaluate their skills and abilities in various domains associated with the data science professional competencies. Students are encouraged to utilise the tool to identify the key competencies associated with their individual career aspirations. For each relevant competency, students evaluate their current competency levels, identify any gaps and use the information to create a set of actions that would form their professional development plan. The competencies model is introduced to students as part of 36100 (Data Science and Innovation) subject through a self-assessment exercise. The competencies are divided into two groups: technical and managerial, describing the following competency (proficiency) levels for each domain: Beginner, Competent, Advanced and Expert.
Technical:
- Mathematics and statistics
- Programing and scripting languages
- Databases and data storage
- Computing systems, platforms, security, integration
- Data mining
- Data modelling
- Analytics, predictive modelling and machine learning
- Data visualisation
- Business analysis and interpretation
- Product development
Interpersonal/managerial:
- Creativity
- Communication
- Data strategy
- Line management
- Data management and governance
- Facilitation and presentation
- Project management
Competency levels:
- Beginner: able to assist and perform simple tasks
- Competent: able to perform tasks independently
- Advanced: able to perform complex tasks
- Expert: able to perform complex transformative, strategic or trans-disciplinary tasks
The competencies assessment exercise aims to prompt the students to take a proactive attitude to their professional development efforts and effectively apply their analytical skills, dedication and professionalism in managing their career objectives.
The competencies assessment exercise covers the following steps:
- Evaluate your current competency level for each domain on the list
- Choose a set of domains (no more than 6) that are relevant to your planned development for this subject, your course and your career goals.
- Identify the goal competency levels for the selected domains and describe related professional development outcomes that support your assessment
- Analyse your development outcomes in the context of your career goals and identify the gaps between your current and goal competency levels
- Develop a set of actions needed to achieve desired level of competencies and bridge the identified gap
- Provide feedback and suggestions for the improvement of the current list of competencies, descriptions etc.
1.3 Ethics and Privacy
Its important to understand that security, privacy and ethics are three different things, although heavily intertwined in the ‘internet of things’.
What is ethical when it comes to data and the internet of things? Is privacy having a login or not being identifiable as an individual?
The world of Ethics and Privacy is changing, similar to the definition that now includes much more than it did a decade ago. Computer security like a login is no longer sufficient to providing protection of privacy which is more focused on ensuring that only people who should have the authority to access your information should be able to.
Current Privacy legislation addresses control and authentication processes of whom can access your information via direct disclosures and how this information should be stored by the party who is collecting this information, it does not address disclosures that can be made based on inferences that can be drawn from big data of which your information is a part. Is the value or conclusions that could be drawn from information as part of big data considered private information?
A sensible framework in relation to Ethics and Privacy where data is concerned is highlighted in the Belmont report which identifies two rules to consider “(1) do not harm and (2) maximize possible benefits and minimize possible harms.”
A big ethical dilema of late is the rich data sources that various provider hold, that if pooled together will strip all possibility of anonymity.
For more on this read:
http://www.tandfonline.com/doi/full/10.1080/08900523.2014.863126?src=recsys http://libres.uncg.edu/ir/uncg/f/N_Kshetri_Big_2014.pdf
1.4 Digital Footprint
Your digital footprint https://en.wikipedia.org/wiki/Digital_footprint is the name given to the data that is recorded about you all day every day. It can be the time and phone number of someone that you called, the mobile phone tower that you were connected to at the time of making the call and how long you spoke for. It is the IP address of your computer when you connect to the internet. It is the list of items you pay for when you go through the checkout at the supermarket and the eftpos card number you used to pay for the items. It is the surveillance footage you appear in when you move through monitored public spaces. It is stories you ‘like’ or share on social media sites. It is the journeys that your GPS navigation stores about your travels. It is every email you send and every click you make when you browse the internet.
Your digital footprint is the inescapable record of your existence by doing nothing more than living your life. It is an important aspect of modern society as many services that you enjoy depend on the data you generate in order to provide critical services. A bank can’t tell you how much money you have without keeping record of your bank transactions. For good or for evil, this data comes embedded with far more information about you. By looking at the kinds of things you spend your money on or the businesses that you spend your money at and the time of day that you spend your money there, it can be determined where you live and where you work.
As an MDSI student, you will learn to think critically and ethically about data collection and how it can be used for good and for evil. The best place to start your thinking is with your own digital footprint, become aware of how big it is and how you feel about it.
It’s important to note that very little permission is sought on data collection and when it is sought, very little education is provided in terms of the use of that data. Very few providers who collect data clarify or specify what the data they collect is used for.
You are responsible for your digital footprint. Generate it wisely.
1.5 Opportunity for overseas exchange
Some great opportunities exist within MDSI with our Program Director having many contacts in many other countries which enable us to be able to explore greater opportunities for overseas exchange.
You need to do a few things before this opportunity is explored as set out by the Program Director to ensure for an easier way forward if this is an opportunity you want to explore.
1.6 Core subjects
Originally, in order to graduate from the MDSI, students were required to finish 6 core subjects (worth 8 cp each) and they were:
- Data Science Innovation (DSI)
- Data Algorithm and Meaning (DAM)
- Statistical Thinking and Data Science (STDS)
- Data Visualisation and Narratives (DVN)
- Data and Decision Making (DaDM)
- Leading Data Science Initiatives (LDSI)
However, since 2019, the course structure was changed and the number of core subjects was reduced from 6 to 4. The core subjects currenly consist of the following (worth 8 cp each):
- Data Science Innovation (DSI)
- Data Algorithm and Meaning (DAM)
- Statistical Thinking and Data Science (STDS)
- Data Visualisation and Narratives (DVN)
The information below was written from past students’ perspectives about the 4 core subjects.
1.6.1 36100 Data Science for Innovation
DSI is the unofficial introductory subject to the MDSI. It sets the scene for a data experience, and gets you thinking about the impact of data in everyday life. You don’t need to have any coding experience to do this subject, although it does introduce data analysis concepts and practice in the assignments. You will explore data as a consumer, practitioner and decision maker whilst understanding ethics and legal requirements in dealing with data issues.
The UTS handbook gives an overview of content and structure of the course; a document you should look at for every subject you undertake.
http://handbook.uts.edu.au/subjects/36100.html
Tips for this course:
Network! As one of the first points of contact with other MDSI students you will be encouraged to mingle and form groups for assignments early in the piece. Don’t be afraid to chat and get to know your classmates as their skills and expertise in their own fields will be beneficial to you throughout the MDSI.
Become familiar with data stories and hot topics by reading blogs and articles. A great place to start is Medium, and to find out what medium is all about read here. There is also a publication called “Trends in Data Science” which started in Autumn 2019 and has articles written by MDSI students in this very subject! Read Trends in Data Science.
1.6.2 36106 Data Algorithm and Meaning
DAM is one of the technical subjects which offer opportunities for building statistical models as well as conducting evaluation techniques in R. You can find additional information from the UTS Handbook here: http://handbook.uts.edu.au/subjects/details/36106.html.
This course provides solid introductory skills such as programming, using statistical techniques and models to make sense of data as well as extracting useful insights via effective visualisation (data analysis in a nutshell). You will also learn about the Cross Industry Standard Process for Data Mining (CRSIP-DM): https://www.sv-europe.com/crisp-dm-methodology/. CRISP-DM is an exceptionally useful framework for data mining. Please note that the programming language used throughout the subject is R and such arrangement is great especially for students who did not have any experience in writing codes using an object-oriented language. Having said that, it’d be beneficial for students to learn how to use packages such as dplyr (data wrangling), ggplot2 (visualisation) and lubridate (date-time manipulation). Both dplyr and ggplot2 can be loaded in a single library called tidyverse.
For additional learning, the following is a list of modules from Datacamp that you might like to undertake before and/or during the course of this subject:
- Data Manipulation with dplyr in R: https://www.datacamp.com/courses/data-manipulation-with-dplyr-in-r
- Data Visualization with ggplot2 (Part 1): https://www.datacamp.com/courses/data-visualization-with-ggplot2-1
- Working with Dates and Times in R: https://www.datacamp.com/courses/working-with-dates-and-times-in-r
- Machine Learning in the Tidyverse: https://www.datacamp.com/courses/machine-learning-in-the-tidyverse
- Cluster Analysis in R: https://www.datacamp.com/courses/cluster-analysis-in-r
Tips for this course:
- What could you do when things are getting all too much?
It could be like going down the rabbit hole in understanding some complex statistical techniques while trying to learn 10 million things at once for 1 part of the assignment. If things are not making sense to you, try another learning module, another blog or another paper! While it’s important to understand the mathematical concept, don’t get caught up understanding every single detail because you’ll run out of time. You’ll start appreciating and applying the concept of minimum viable product (MVP) which is very important in the commercial world!
- Go wide or go deep?
At the early stage of the journey of becoming a good data analyst/scientist, it is usually more important to acquire knowledge in a wide range of tools/techniques than going deeply into one. Play and have fun with as many tools as your heart desires!
1.6.3 36103 Statistical Thinking and Data Science
STDS is a core subject that has been delivered in combination of evenings and all day saturday sessions. After completing this core subject it is the equivalent of completing first year undergraduate honours statistics in a condensed mode. More information can be found in the handbook: http://handbook.uts.edu.au/subjects/36103.html
If you have never completed a statistics class or would like a taster before you commence the subject, it is highly recommended that you complete the pre-flight checklist and some references are provided at the end of the test: http://www.uts.edu.au/future-students/analytics-and-data-science/essential-information/mdsi-statistics-pre-flight-test
In this course, you will:
- present your findings from data projects and develop storytelling techniques
- work with big open-source datasets, possibly using application programming Interface (API). Please use your creativity and explore local and international websites
- learn how to frame a problem statement
- test hypotheses
- Learn how to prepare a statistical report
A few places to locate an interesting dataset:
- Google dataset search: https://toolbox.google.com/datasetsearch
- US data: https://www.data.gov/
- Kaggle: https://www.kaggle.com/
- Github: https://github.com/
- Australian data: https://data.gov.au/
What you might learn in this course:
- Logistic regression
- Dimension Reduction - Principal Component Analysis (PCA)
- Clustering - Hierarchical clustering
- Generalized linear mixed models
- Multiple Linear regression
Tips for this course:
Develop a good relationship with your lecturer and tutor to review project proposal and ask lots of questions!
Learn to sit comfortably with ambiguity.
Additional Resources:
Statistics and R course by Harvard University: https://online-learning.harvard.edu/course/statistics-and-r
Try out Datacamp courses in R. As an enrolled MDSI student, all courses are free.
1.6.4 36104 Data Visualisation and Narratives
The key to success in DVN is to appreciate that unlike most other subjects the aesthetics take centre stage over the written content. Having completed this course you will find yourself applying more attention to how you present visual information and become more considerate to your audience’s visual information needs. The first assignment is to experiment and critique three data visualisation tools. The second assignment create three data stories visually with one being your show case with any tool/s of your choice. The final assignment is a collaborative report utilising all the knowledge gained to apply the best practice of data visualisation principles learned in class. You should aim to produce visualisations that allows a story to be told cohesively in a written report.
The information about this subject is available below: http://handbook.uts.edu.au/subjects/36104.html
For those who are not highly proficient using programming languages for visualisations, it would be best advised to use a GUI based tool like Tableau or Click for assignments 2 and 3, you need to be mindful not to lose valuable time working the program rather than developing the desired visual outcome as it will take longer than you might think to pull a good visual data story together. Ideally, you would like to be able to produce a dashboard or interactive visualisation for your final workshop assignment.
Tips for this course:
It is highly recommended to have a unique dataset with an interesting story to tell before or early in the semester. - This is especially so for assignment 2, the sooner you have this the easier the work will become.
Spend the time curating data and applying best practice to visualise important points in data story. - Do this and a HD will come your way!
1.6.5 36109 Data and Decision Making
http://handbook.uts.edu.au/subjects/36109.html
Delivered in three parts, DDM provides practical yet powerful methods for making strategic choices, dealing with ambiguity when working in collaborative environments and developing a business plan. Assignments are aligned to each part of the subject. The first topic has you apply data modelling to use in a business strategy scenario. Students are introduced to Bayes theorem, Monte Carlo modelling to simulate probability of strategic choices. The second topic is on sensemaking and removing ambiguity, introduces tools to visualise and encapsulate differing opinions and choices to gain clarity and insights for planning and collaborating with others. Final topic looks at business planning the level of detail required to bring an idea to market. Finally, bringing the three parts together the third assignment come up with a group based business plan with a realistic budget using the techniques learned in parts one and two.
Tips for this course;
Come prepared with a great business idea you might seriously like to pursuit
1.6.6 36101 Leading Data Science Initiatives
http://handbook.uts.edu.au/subjects/36101.html
For those who have no or limited project experience, this is a great introduction to project management. Here you will gain exposure to the Waterfall and Agile project management methods. LDSI focuses on understanding the stakeholders, project roles and responsibilities, restraints and gathering project requirements, budgeting and time management for project delivery with the very different but useful methodologies such as Agile and Waterfall.
Compared with the other MDSI subjects, this is the most ‘textbook-intensive’ since there are many governing rules and standards to follow e.g. PMBOK, PRINCE2 and Waterfall practices.
Assessments are interesting, the first assignment is a weekly reflection where students are asked to work in teams and answer a project-based/leadership-related question. The second assignment is a personal development plan which is meant to be self-reflective as well as to help students develop leadership (mentoring) skills. The third assignment is a workshop with Transport NSW. Students in each team are asked to provide a project management and budget plan as a solution in delivering one of their real-life data projects.
Tips for this course;
read up on Agile and PMBOK prior to semester start
1.7 Electives
You need to select four electives during your MDSI course. These electives should be selected to assist you in your growth as a student and as a data science professional. These subjects enable you to add to your toolbox of where you are heading with your journey.
Electives can be selected from any school however you will still be subjected to the pre-requisites for any possible subject, so it will depend on the requirements of the subject.
We suggest that when you apply for a subject with a prerequisite that you also apply for a waive of the prerequisite if the prerequisite is a subject you are familiar with but have not done with UTS and get exemption for that requisite.
This is not always easy, or approved and is subject to each School’s internal views or policies. It is definitely a consideration to take.
You can apply for the subject ( and a waiver of prerequisites if required) early as CIC is not limited by inter-faculty time restrictions.
Our best tip is : get in early.
If you are wondering where is the place to find more information about electives, we encourage you to visit the Guide to choose the right elective subjects.