2 A ‘survival guide’ to MDSI
2.1 First steps
2.1.1 Your UTS email:
First and foremost you need to activate your UTS email address. All official communications from UTS, subject notifications, MDSI newsletters etc will be sent to this email address. You need to activate your email address before you can access other UTS systems.
Activate your UTS Student email:
- Navigate to https://email.itd.uts.edu.au/webapps/myaccount/activation/ and follow the steps to activate your UTS student email account.
- ** Protip: ** If you don’t want to login frequently to check if you have mail, simply setup a email forwarding to an email address of your choice via the settings page after logging in.
For more general information about using UTS systems go to: http://www.uts.edu.au/current-students/managing-your-course/using-uts-systems/uts-student-account
2.1.2 Enrol in your subjects:
It is really important that you check your enrolment. If you are not enrolled, you cannot participate in your studies. This might seem obvious, however at UTS you need to do more than simply accept your offer. Once you have received and accepted your offer to study, you then need to enrol into your subjects.
If you have not enrolled, you need to login into the My Student Admin https://onestopadmin.uts.edu.au/estudent/Login.aspx portal to enrol.
For more information about enrollment and a step by step instruction guide, please visit:
http://www.uts.edu.au/current-students/managing-your-course/your-enrolment/how-enrol
2.1.3 Get your subject outlines:
 MDSI uses a variety of systems for online teaching and learning. Canvas http://canvas.uts.edu.au/ and CICAround https://ca.uts.edu.au are the two primary environments for you to familiarise yourself with.
The first thing you need to do after activating your email address is to login to Canvas, access your subjects and find your subject outline. Your subject outline contains everything you need to know about your subject for the coming semester. It includes the contact information for your subject co-ordinator, important dates, assessment descriptions and much more. In most cases you can find the answer to any question you might have about your subject addressed in the subject outline.
Find your subject outlines in UTSOnline:
- Login to Canvas at http://canvas.uts.edu.au/ using your student ID number and the password you setup for your UTS email account.
- Access your subjects by clicking on your subject name
- Download your subject outline by clicking on it within the introductory materials for each subject.
2.1.4 Join the MDSI community:

Your next stop should be CICAround. Here you will connect with your peers in an academic capacity. There are discussion forums for your subjects where you can post questions. CICAround most notably is where you will go to blog about your experiences throughout your MDSI journey. The first step is to activate your blog. Then you can browse through the blogs of your new MDSI family and read about their experiences and the things they have learnt.
Activate and personalise your CICAround profile:
- Navigate to https://ca.uts.edu.au/using-ca/
- Watch the welcome video then login to CICAround using your student ID and password.
- Put up your first CICAround Blog post
2.1.5 Join the MDSI chatter:
Slack has proven to be a very useful tool so far. It is completely driven by the student community and is where the MDSI student community goes to socialise, organise BBQs, ask each other for technical help and share useful resources. If you need a quick answer, Slack is the place to go.
Getting started with slack
- How to download the app to your desktop :
- Download the Slack application here
- Click on Download
- Sign into your workspace
- After installing Slack, we can sign into a workspace where we are already a member.
- Sign up to the MDSI group at MDSI Slack
If you’re completely new to Slack, here are some helpful links :
2.1.5.1 Channel Naming Conventions
General notes:
- For channel names:
- All names use snake_case, see table below for prefixes to use
- No capital letters
- Archive channels when finished using them
- Note: They will still be visible in search results
- Search for an existing channel that serves your purpose before making a new one
- Rename channels where you find them that do not conform to the naming conventions.
- If you create a new channel, please conform to the naming categories below and feel free to post in #mdsi_announcements to let people know to join your channel!
Here are the conventions to use for naming channels.
| Prefix | Explanation |
|---|---|
| ds_ | Anything generally data science related. Jobs, tips etc. ds_jobs for example. |
| dev_ | R, python, data viz, other technical aspects of data science. dev_r is an example. |
| ds_hackathons | Information, links etc about hackathons in general |
| ds_hack_X | For a specific hackathon. For example ds_hack_unearthed |
| mdsi_ | Admin, announcements and happenings related to the MDSI side of things. mdsi_announcements is the major channel. |
| mdsi_subj_sem_yr | How to name course channels. mdsi followed by a subject description such as dam or dvn followed by the sem (spr or aut) and the year as yy. For example mdsi_dam_aut_18 |
| oth_ | For other things outside mdsi and data science. Random humour, notes, comments etc., such as oth_humour |
| pv_ | A private channel for group members to chat about something. Call it whatever you like after the pv_ |
2.1.5.2 Slack Private channels
Steps to create a private channel:
- Click the (+) plus icon next to Channels in the left sidebar
- Enter a channel name. Names must be lowercase, without spaces or periods, and shorter than 80 characters
- Add a purpose so that other people know about the channel
- Add others to the channel: start typing a name, then select it from the drop down menu to add that person
- We can also add person later on
- Use the toggle to make the channel private, When a channel is set to private, it can only be viewed or joined by invitation
- When you’re ready, click Create channel
2.1.5.3 Slack Public Channels
The below list contains information about the popular public channels among MDSI students. Please feel free to join.
| Channel | Details |
|---|---|
| mdsi_announcements | Primary channel for course-wide announcements and queries. |
| mdsi_electives | Channel to get your questions clarified about electives. For reviews about electives taken by previous MDSI students please visit the Selectives site. |
| mdsi_cicaround_help | Facing any issues with CICAround? Reach out to the channel. |
| mdsi_datacamp | Problems related to accessing datacamp courses can be addressed here. Note - Datacamp subscription is free for all MDSI students. |
| mdsi_help | Channel to seek general help and guidance from MDSI peers. |
| mdsi_course_review | Review in-development MDSI course materials. |
| dev_r | Stay up-to-date with recent developments in R programming environment. Post to the channel if you need any help with debugging. |
| dev_python | Questions related to Python programming environment are to be directed here. |
| dev_other | Questions related to analysis/development in any language other than R or Python. |
| dev_data_vis | Discussion regarding data visualisation best practices and popular packages/tools in market. |
| dev_machine_learning | News, articles and discussion regarding the latest developments in the world of Machine Learning and AI. |
| dev_collaborate | Collaborate with peers on personal projects outside MDSI curriculum. |
| dev_datasets | Found an interesting dataset? Post it to the channel. Ask help for dataset search. |
| dev_nlp | Questions and discussion regarding Natural Language Processing (NLP). |
| dev_deep_learning | Discussion regarding neural networks and its variants. |
| ds_jobs | Job posting channel of the MDSI community. |
| ds_cool_stuff | Links or recommendations on cool tools you’ve seen around that may be useful to the MDSI community. |
| ds_hackathons | Articles, updates, insights, discussion and announcements about hackathons. |
| ds_protips | Learn from the pro’s working in the industry and fellow MDSI graduates. |
| ds_privacy | News, articles and discussion about data privacy. |
| ds_data_ethics | Essential channel about discussion on data ethics. |
| free-stuff | Who doesn’t love free stuff? Keep an eye on the channel! |
| events-of-interest | Information about upcoming conferences, meetups and other events of interest are posted here. |
These are the active channels as of August 2019. New channels may appear and the list would be updated.
2.1.5.4 Slack Command Shortcuts
Before posting any question, it is recommended to search Slack for past conversations. There was always someone in same place as you and possibly started a discussion in a channel. Knowing the commonly used Slack shortcuts would help in the long run. Some resources to grasp the basic commands:
2.2 Technology
2.2.1 Tools Used for Coursework and Admin
2.2.1.1 Google / Office 365

Your university account allows you access to Google Apps and Office 365.
Google Apps access does not include Gmail. You can not login to your UTS google apps account via gmail or if you are already logged in with a personal gmail account, you will need to switch accounts to your student account to use facilities such as Google Drive is used a great deal in the courses for sharing material.
Once you have done this, you can log in using your student email address. This will revert you to a UTS login page. Use your UTS student number and password and it will revert you back to the Google Drive, but you will be logged into the drive.
Similarly you can mimic the same steps for Office 365.
2.2.1.2 Review
Review is an assessment tool that is used to mark your work, give you your marks and give you feedback about your work. It also helps getting a sense of what is expected by indicating what you think you would get as a mark before it is assessed by teaching staff.
Review allows you to see feedback from your lecturer as well as your mark broken down by specific Graduate Attributes(GA) and Course Intended Learning Objectives(CILOs) set out by your assignment.
It also allows you to self assess your assignment, which allows the lecturer to see if your expectation is in line with their expectation. It’s important to note that the lecturer will not be able to see your self assessment until after they have saved your mark.
You are also able to see the average of the class as well as where the staff has measure you.
Review is available at: https://uts.review-edu.com/uts/
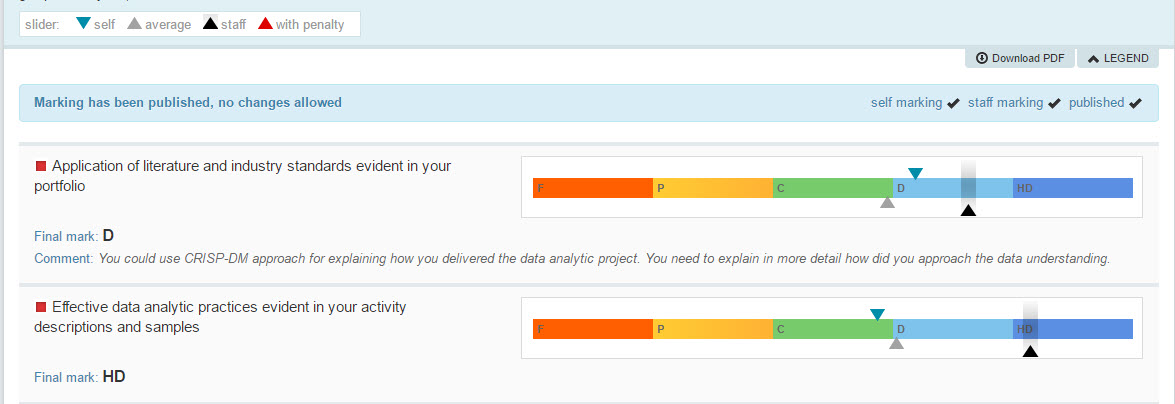
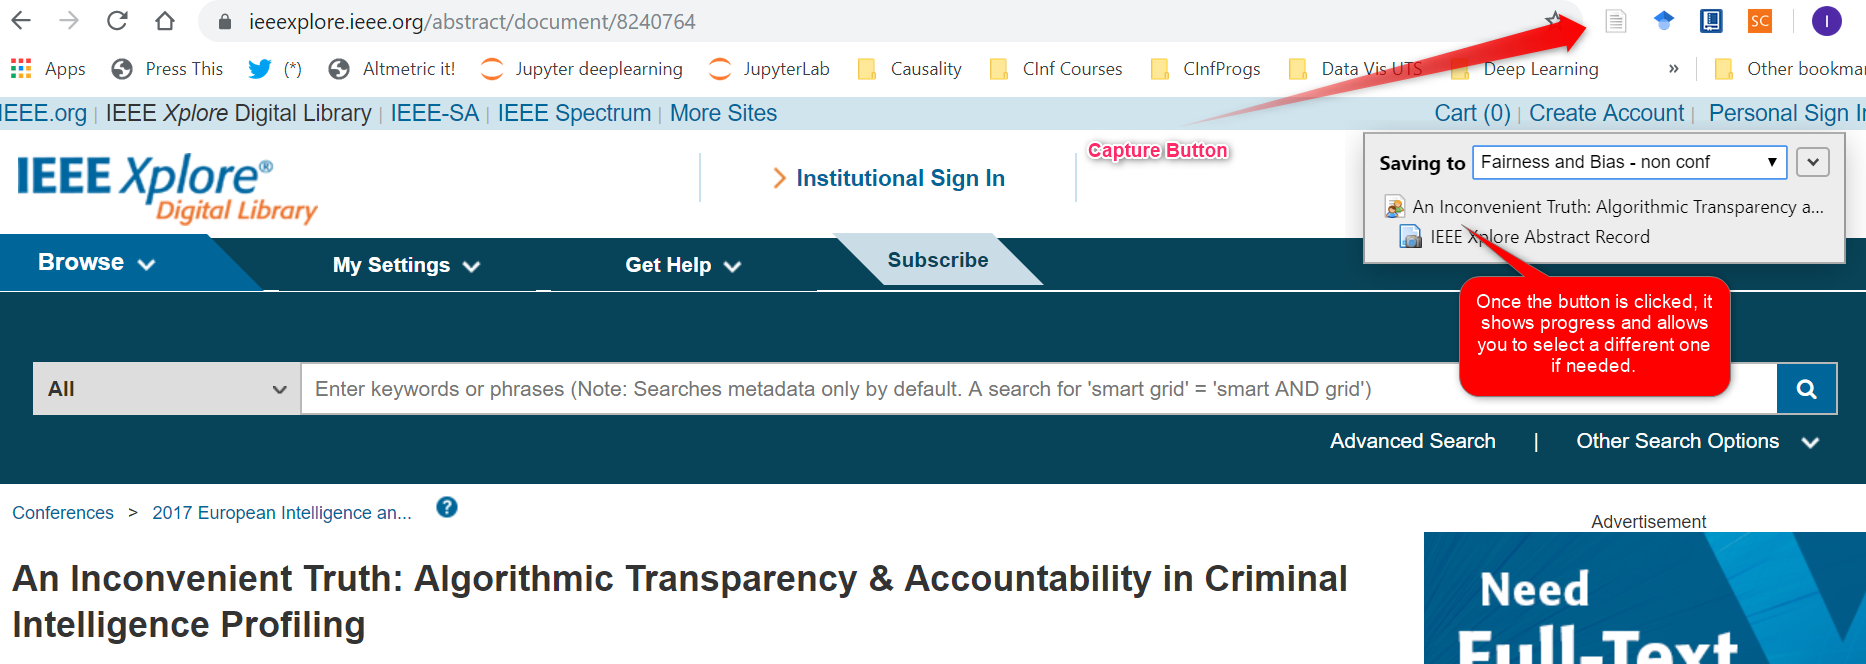
2.2.1.3 Zotero for Bibliographies & Referencing
![]()
One of the things that can be very time-consuming when doing assigments is managing academic references and citations, particularly if doing them manually. This is something you will need to do for many assignment.UTS requires the Harvard - UTS style for citations and references, which look like this and were generated from Zotero:
Reference:
Zouave, E.T. & Marquenie, T. 2017, ‘An Inconvenient Truth: Algorithmic Transparency & Accountability in Criminal Intelligence Profiling’, Proceedings of the 2017 European Intelligence and Security Informatics Conference (EISIC), pp. 17–23.
Citation:
(Zouave & Marquenie 2017)
Zotero is a fabulous tool for automatically reading all the citation information from an online journal and parsing them into the correct fields, and importing the PDF of the document if it is available. So it catalogues and arranges all your research material at the click of a Zotero addin button in Chrome. It can also capture web pages, blogs etc and picks up lots of information even for those. It has many standard referencing styles and choosing the Harvar-UTS style is perfect for your UTS assignments.
The user interface is very intuitve and flexible and lets you manage research like in a file system.
2.2.1.3.1 Capturing documents from Google
It is easy to capture documents. There is a Google Chrome addin that adds an icon that captures the entire document, a snapshot, all the metadata about a document and the PDF of available.
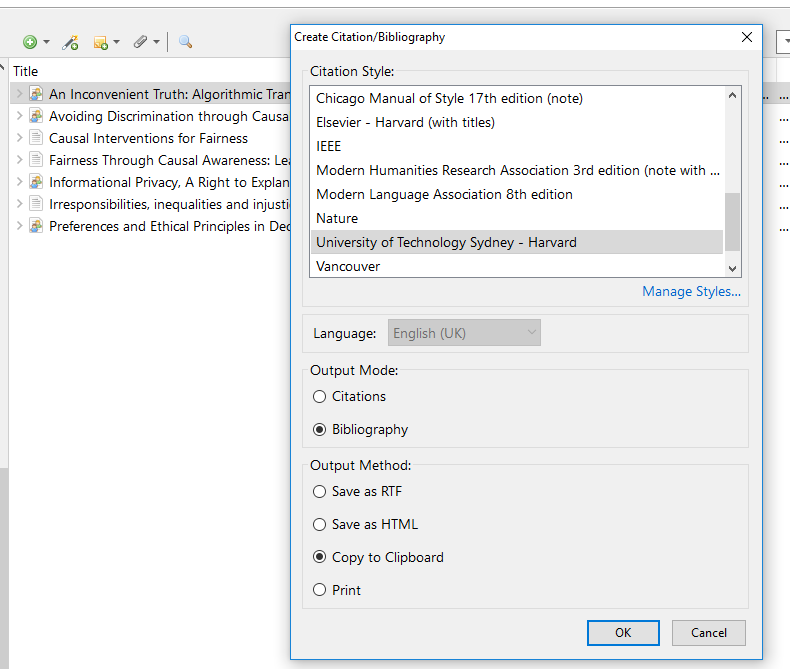
2.2.1.3.2 Creating Bibliography References and Citations
Once the document is captured, creating your refernces and citations is as easy as clicking on Create Bibliography, clicking on Citation or Bibliography options, which copies it to the clipboard, then pasting it into your document.
It literally takes a few minutes to load a document to Zotero and get your reference into your assignment. Highly recommended application.
One amazing thing is allows is to select all documents in a folder (which can be sorted by author which is required in most bibliographies) and choose “Create Biblography” and paste the whole lot into your word document, sorted by author! Amazing saving in time.
It can be downloaded from https://www.zotero.org/ and is a free application available for Mac, Windows and Linux.
2.2.1.3.3 Other Resources
There are other bilbliography and referencing application and some good resources to find one for you, as there are many to choose from, is:
2.2.2 Languages
The languages you will use on this course will mostly be the data science languages R and Python. In today’s data science world, besides mathematical skills there is a requirement for programming skills in order to be prominent in this field. Before gaining expertise, an aspiring Data Scientist must be able to make the right decision about the type of programming language required for the job.This markdown lists out the critical programming languages of today’s data science world.

2.2.2.1 R and R studio
R is a coding language used by most of the data science community.The R language is widely used among statisticians and data miners for developing statistical software and data analysis.

RStudio is a software program or an Integrated Development Environment (IDE) that makes working with the R language ALOT easier. The programming environment is really flexible as it allows you the joy of working in a notebook format, scripting, markdown and publishing your work as a PDF.
You will use R in many of your subjects and being able to use it well will give you a serious edge over your classmates and competitors at hackathons.
Download and install R & RStudio free
Download and install the R language: https://cran.rstudio.com/
Download and install RStudio IDE from https://www.rstudio.com/products/rstudio/download/
Libraries well worth their weight in gold:
With over 10,000 packages in the open-source repository of CRAN, R caters to all statistical applications. Another strong suit of R is its ability to handle complex linear algebra.
readr http://readr.tidyverse.org/ for reading all kinds of data formats
stringr http://stringr.tidyverse.org/ for working with text
ggplot2 http://ggplot2.tidyverse.org/ for visualising data
tidyr http://tidyr.tidyverse.org/ for creating tidy data
dplyr https://github.com/hadley/dplyr for manipulating data
caret http://topepo.github.io/caret/index.html for creating predictive models
Bookdown https://bookdown.org/ for creating beautiful documents
Sparklyr- https://spark.rstudio.com/ for Appache Spark interface.
RMySQL-https://cran.mtu.edu/web/packages/RMySQL/index.html for connecting R to MySQL’ databases.
2.2.2.1.1 R: Getting Started
The resources below would help a great deal to progress from being a beginner to a pro.
R for Data Science by Garrett Grolemund and Hadley Wickham - http://r4ds.had.co.nz/
R Data Science tutorials: https://github.com/ujjwalkarn/DataScienceR
Datacamp- Data Scientist with R https://www.datacamp.com/tracks/data-scientist-with-r
Datacamp- Data Scientist with R https://data-flair.training/blogs/data-analytics-tutorial/
2.2.2.2 Python / Rodeo / Jupyter Notebook
Python is a general purpose coding language widely used by the data science community. A great place to start is with Anaconda from Continuum Analytics : https://www.continuum.io/downloads
Anaconda comes with a ‘container’ management environment called ‘conda’ and ships with a collection of scientific python libraries that have optimised for fast computation. It is also really helpful to manage your libraries and will let you know if there are incompatibilities between the libraries you are using. This is just the tip of the Anaconda iceberg.
The Jupyter notebook combines two major components:
A Web based application for an interactive environment to code in Python
A notebook to run the Python code from start to finish and represent all content visible in the web application- like text, mathematics,graphs and media images.
** Jupyter notebook installation guide ** https://jupyterlab.readthedocs.io/en/stable/getting_started/installation.html

If you prefer an R style IDE, then Rodeo by Yhat is for you. https://www.yhat.com/products/rodeo
If you prefer a traditional IDE, you can get a free license for PyCharm (as well as all their other products) from JetBrains using your student details: https://www.jetbrains.com/student/
Libraries well worth their weight in gold: The most popular language among developers has more than 140K libraries to aid many applications.Most of the enterprise and government organisations have Python clusters built as part of the data-infrasturcture. To solve real world data science tasks and challenges it is therefore necessary to master these Python libraries
- Numpy http://www.numpy.org/ for working with numerical arrays
- Scipy https://www.scipy.org/scipylib/index.html for scientific computing with python
- Matplotlib http://matplotlib.org/ for visualising data
- Seaborn http://seaborn.pydata.org/index.html for statistical visualisation
- Pandas http://pandas.pydata.org/ for working with data
- Statsmodels http://www.statsmodels.org/stable/index.html for creating statistical models
- Scikit-Learn http://scikit-learn.org/stable/ for doing machine learning with python
- Tensorflow https://www.tensorflow.org/a deep learnin with python
Where R and where python: R is a statistican’s delight but python is more of a general purpose data science language. Some good blog posts to illustrate the difference
R vs Python for Data Science: The Winner is http://www.kdnuggets.com/2015/05/r-vs-python-data-science.html
R vs Python for Data Science: Summary of Modern Advances https://elitedatascience.com/r-vs-python-for-data-science
2.2.2.2.1 Python: Getting Started
Python Data Science by Jake VanderPlas https://github.com/jakevdp/PythonDataScienceHandbook
Machine Learning With Python https://realpython.com/learning-paths/machine-learning-python/
DataCamp’s Data Scientist with Python Tutorial https://www.datacamp.com/courses/intro-to-python-for-data-science
- Some more Github resources and corners of the web to explore: https://www.analyticsvidhya.com/blog/2016/09/most-active-data-scientists-free-books-notebooks-tutorials-on-github/
Prof Richard Xu https://github.com/roboticcam
2.2.2.3 Structured Query Language-(SQL)
SQL is the langauge used to operate in relational databases. It is used to query, insert, update, modify data.
SQL is a non-procedural declaritive language :
Cannot write a complete application
Simple, but a powerful Query Language
SQL used to Read/Retrieve Data - So Data is often stored in a Database. It is also used to write Data in a Database and finally, it is used to Update and insert new data.
Very often retrieving data is a very critical part of a data scientistis life and SQL plays a critical part.SQL is primarly used to perform three major actions
Read/ Retrive data
Write data
Update new data
Most databases, both those that have been around for a long time and those that are newer types of architectures, like Hadoop, have SQL interfaces for interacting with the database. The type of database that is chosen for a particular application will depend on the performance and scaleability required. Some examples are:
Microsoft SQL Server
PostgreSQL
SQLite
IBM DB2
Oracle
2.2.2.3.1 SQL in the Data Science world
As a data scientist data retrival is the first stage of the ‘Data preparation’.We cannot do anything until we have the actual data to work with. Even though SQL is not used much in Data Analysis,it plays a very critical role in Data preparation.
2.2.2.3.2 SQL and other data-science tools and technologies
R and Python allow connections to most existing databases. Hence connections to SQL databases can be established in a hassle free manner with these databases.
R uses the package RSQLite and dbplyr to connect to database
Python uses MySQL connectors to acces MySQL databases
Tableau and Power BI allow seamless connections to SQL databases
2.2.2.3.3 SQL: Getting Started
Intro to SQL for Data Science - Data Camp.
SQL for data science - Coursera
SQL and R - https://datacarpentry.org/R-ecology-lesson/05-r-and-databases.html
SQL and Python - https://www.w3schools.com/python/python_mysql_getstarted.asp
SQL and Tableau - https://www.datacamp.com/community/tutorials/sql-tableau#importing
SQL and Power BI - https://www.datacamp.com/community/tutorials/sql-with-powerbi
2.2.3 Visualisation Tools
You will need to get comfortable with a number of visualisation tools. Some tools are standalone applications that integrate with R and Python programes, such as Tableau and Power BI, and some are packages that work from within either R or Python code. This sections covers some of these as a starter set for you to get familiar with.
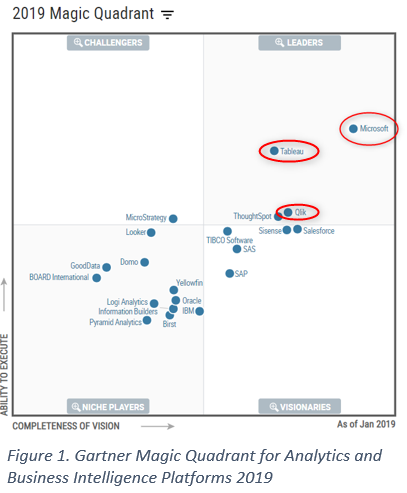
Below is the 2019 Gartner rankings of Business Intelligence applications. The full report can be found in the Gartner database in the online UTS Library site. This section covers three of the top rated BI applications (Tableau, Microsoft Power BI and Qlik) as well as other important visualisation tools used when working with visualisations within the code when developing with R and Python.
2.2.3.1 Tableau

Tableau is a high-end business intelligence visualisation tool, rated second top in the leaders quadrant by Gartner Group in their annual Magic Quadrant report and way above most other tools. It is very powerful and easy to use and is extremely popular in large organisations as their business intelligence platform for visualisation.
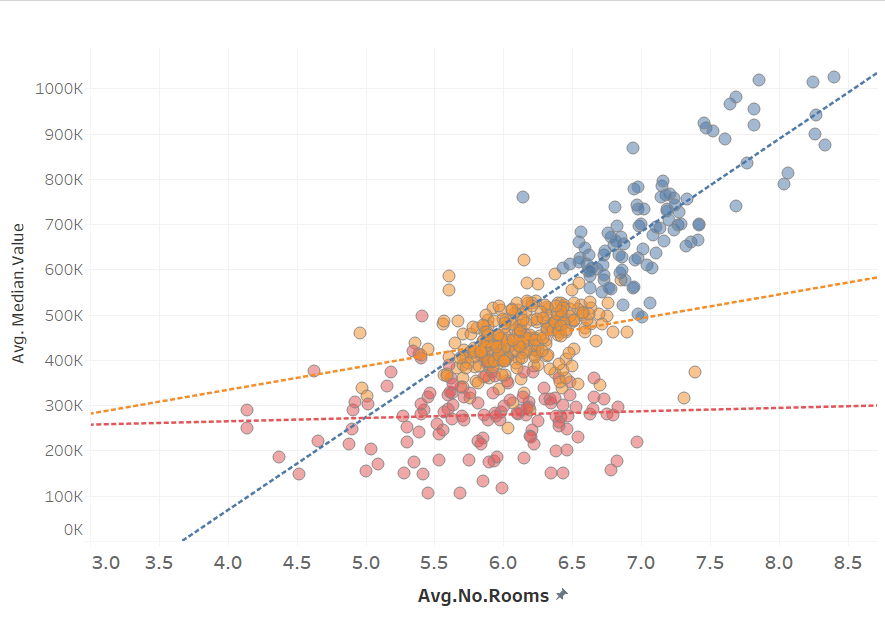
It has a number of Data Science algorithms built in, which can be incprporated into visualisations using simple drag-and-drop features. These include linear and multinomial regression, clustering and forecasting. These algorithms are great for doing fast exploratory analysis just using drag and drop features. Example shown below of clustering and linear regression of the clusters.
It also has the ability to connect to datasets on a huge variety of data source technologies, both on your computer, in your organisation and across the internet.
For a more detailed look at the data science capabilities see the Introductory Tutorial on Data Science Capabilities of Tableau
It is a very easy to use tool, but like most sophisticated tools, using the free Tableau short and concise training videos, it is fast to pick up the skills.
Go to the Tableau Training Site, sign up and get started.
To see some of the amazing charts that users submit to the Tableau cloud service, see the user submitted charts in the Public Gallery
If you sign up to Tableau Public, you too can publish your amazing vizzes!
As a student you can apply to the company for a free license to their commercial desktop version. It is actually good to learn this tool, which is heavily used for visualisation in large organisations, as it is extremely expensive to buy, so take advantage of the free licence to learn it for free while you are studying: see the Student Licence Program for details of how to apply.
2.2.3.2 Qlikview and Qliksense from Qlik
Qlikview and Qliksense are from the same parent company, Qlik Technologies, though products are a little different. Qlikview excels at reporting or presenting specific topics, which is particularly useful for stakeholder engagement. QlikSense offers governed data discovery and augmented analytics. They are used heavily in healthcare and government.
For more detail see the Introduction to Qlik for Data Science
Students can get Academic license for free at the site for their Academic Program
2.2.3.3 Microsoft Power BI
Power BI is Microsoft’s premier and highly rated Business Intelligence application which, in the Enterprise edition, integrates with its Azure machine learning platform. However,the The free desktop version does not have that capability but is an extremely functional tool even including clustering and forecasting.
It can be downloaded from https://powerbi.microsoft.com/en-us/downloads/ and the the guided learning site on the Microsoft site
For an introduction to the data science capabilities of Power BI see Introduction to Power Bi for Data Science
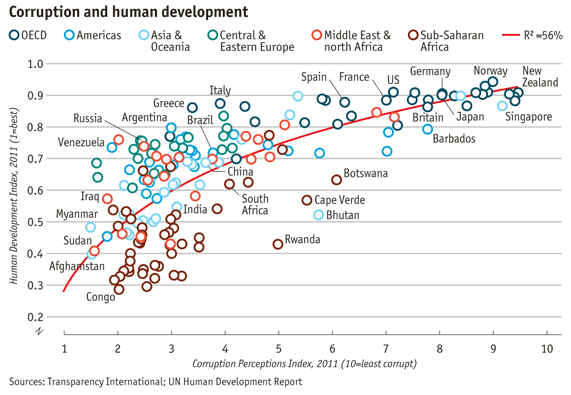
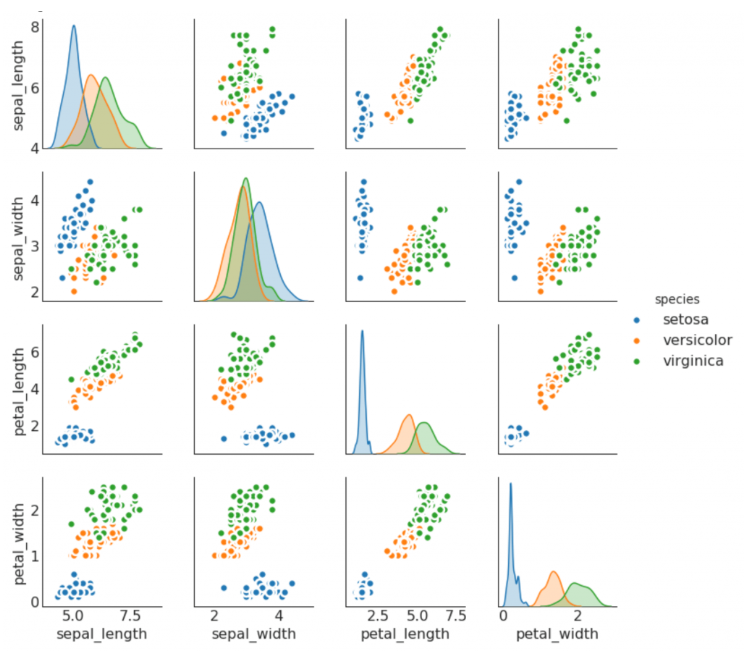
2.2.3.4 ggPlot2 for charting using R
ggPlot2 is an R package for creating visualisations from within R programs. There is a ggplot library for Python that replicates the R functionality if you are working in Python and would like to utilise it.
ggPlot2 “visualisation” language describes the plot you want to see, however, it is quite complex. It is very powerful and allows you to layer many components of a viz on top of each other. For example, a scatterplot which is overlayed with a trend line.
An invaluable resource for ggPlot users that find ggPlot options difficult to use is the Top 50 ggPlot Visualisations page which has an example of just about any sort of plot that can be done in ggplot along with the code so that you can copy and paste then modify if you are having problems figuring out how to get the plot that you want.
Another great and similar resource for ggPlot is from STHDA site Guide to ggplot2 which has loads of examples
ggPlot2 example
source: https://tutorials.iq.harvard.edu/R/Rgraphics/Rgraphics.html
2.2.3.5 Matplotlib for Python charts
The most widely-used library for plotting in the Python community is Matplotlib. It has a wide range of plots including:
Scatter plots
Bar charts and Histograms
Line plots
Pie charts
Stem plots
Contour plots
Quiver plots
Spectrograms
A great free resource with a huge library of Matplotlib chart examples along with the code to create them is Top 50 matplotlib Visualizations
A Matplotlib example:
There are several other good libraries for Python and The Best Python Data Visualization Libraries is a good resource that gives an overview of several others.
2.2.3.6 Plotly for Interactive Charts in R, Python and other environments
Looking for a visualisation tool that can be used in both Python and R, Plotly is a charting library that is growing in popularity. R packages like ggPlot2, while very powerful in terms of overlaying many aspects in a single graph, have little interactivity, poor default colour palettes and is complicated to produce high quality visualisations. Plotly has libraries that support several environments: Python, R, MATLAB, Perl, Julia, Arduino, and REST.
See example Plotly chart below which is a grouped boxplot of the standard “diamonds” dataset from the ggplot2 R package. It shows the Price vs the cut of the diamond. Hover over the image to see the interactivity - click on the legend to exclude values. Hover over the title to see the popup bar with zoom, compare and other options.
For a further mini tutorial on Plotly, see Plotly for Interactive Charts
# demonstration of a grouped boxplot using plotly and the diamonds dataset from ggplot2
library(plotly); library(ggplot2)
data("diamonds")
plot_ly(diamonds, x = ~cut, y = ~price, color = ~clarity, type = "box") %>%
      layout(boxmode = "group") %>%
layout(title = "Boxplot Statistics for Price vs Cut and Clarity")2.2.4 Data Science In the Cloud
Typical data science workflow consists of following steps executed iteratively.
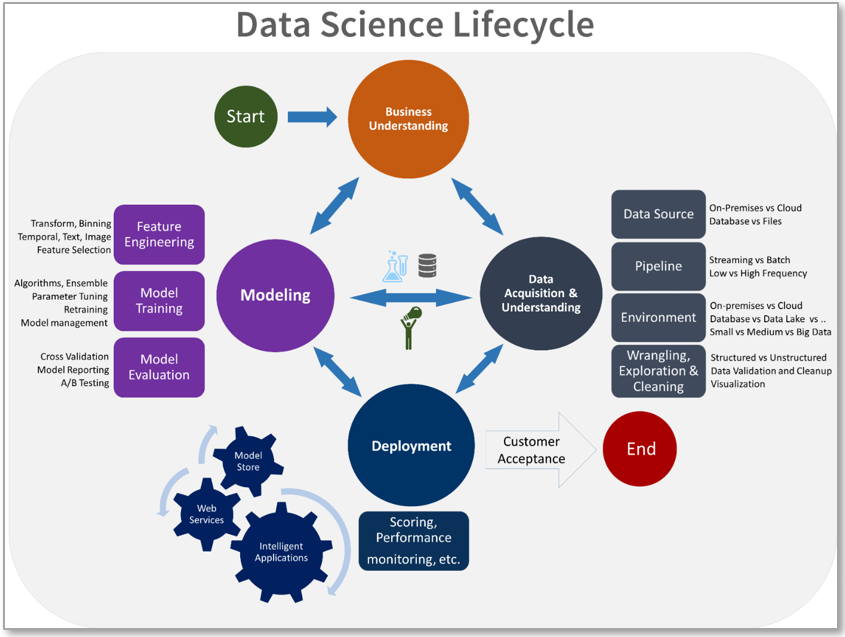
Source: What is the Team Data Science Process?
Often it is not practical or desirable to perform all data science or big data-related tasks on a local development environment for the following reasons.
Datasets are too large and will not fit into the development environment’s system memory (RAM) for model training or other analytics
The development environment’s processing power (CPU) is unable to perform tasks in a reasonable or enough time, or at all for that matter
The deliverable needs to be deployed to a production environment, and possibly incorporated as a component into a larger application (for example, web application, called via API)
In such situations arise, there are multiple options available. Instead of using the data scientist’s local development machine, typically people offload the computing work to either an on-premise machine, or cloud-based virtual machine. The benefit of using virtual machines and auto-scaling clusters of them, is that they can be spun up and discarded as needed, where necessary tailored to meet ones computing and data storage requirements.
Cloud Computing Platforms
Below are some of the more popular platforms for data science workloads.
Microsoft Azure Anyone can sign up with an email address. During the first 30 days receive AUD 280 credit spend, plus list of popular services free for the first 12 months, and another 25 services always free.
Amazon AWS AWS offers always free tier products plus range of other products free for 12 months following initial sign-up.
Google Cloud A 12-month free trial with USD 300 credit to use any services, together with an always free access to commonly used resources.
Colaboratory Colaboratory is a research tool for machine learning education and research. It’s a Jupyter notebook environment that requires no setup to use and it is free to use.
Paperspace Paperspace is a cloud platform with a range of products at low prices. It is a fully-managed enterprise GPU cloud platform. Desktops, terminals, and servers. They have server configurations with both hardware and software stack configurable. They have standard stacks in both python and R. Their stapline is “The first cloud built for the future. Powering next-generation applications and cloud ML/AI pipelines.”
Make sure you claim your $100 student credit when you sign up to the Github student pack https://education.github.com/pack
2.2.5 Code Version Management & Collaboration
The service and software in this section are used for version control of code and documents and for collaborative working when developing applications. The open source community has for many years been using the Github service which runs the Git code. A more recent addition is the Bitbucket service, which also runs Git, but has different user interfaces which are more user friendly.
You use a version management system when multiple people are working on development as it provides a central repository of the current version of the code and documents. Multiple people can then work on copies of the current version, make changes and submit it to the central reponsitory. That will then be reviewed by the owner, and if they approve, become the current version of the file. This allows development teams to collaboratively work and modify and create new files which are then integrated in a controlled central respository.
2.2.5.1 Github

Github is the original Git service and is used extensively by the open source community. It has a massive following and claims over 40 million users. The user interface is web based and found at https://github.com/. Having an account on Github gives you access to loads of free open source software.
The use of Github is free. However, if you want to have private reponsitories that are not open to the public, then they charge a fee.
Github has a really generous collection of free stuff for students. To claim yours head over to: https://education.github.com/pack
2.2.5.2 Bitbucket & SourceTree


Bitbucket is a git server service by Atlassian with a much more friendly web front end. In addition, it also has an application called SourceTree which is even friendlier front end for managing collaborative work particulary the management of branching in a team collationation situation.
Bitbucket is free for up to 5 users and is has more extensive versions thare are priced on a per user basis.
Go to https://bitbucket.org/ and sign up at no cost.
To download SourceTree, which works with Bitbucket as an alternative user interface, go to https://www.sourcetreeapp.com/. SourceTree is a free application.
2.3 Writing
2.3.1 Blogs
More and more academics and workplaces use blog posts to reach clients, audiences and share knowledge. Blogs can be useful for many reasons and is used as a reflective tool for students as well as providing an opportunity to share any learning.
You can use some tools to turn topics into amazing titles by using keyword suggesters (http://keywordtool.io), title generators ( https://www.portent.com/tools/title-maker), and you can also test your headlines with the following tool (http://coschedule.com/headline-analyzer#)
Tips for new bloggers
- Use an eye catching title
- In-text links
- Use pictures, pictures speak a thousand words
- Keep post to 1000-1500 words
- Use social sharing buttons
- Use paragraphs - one idea per paragraph
- Revise and Rewrite
- Omit needless words - Use the KISS (Keep It Simple, Stupid) Principle
- Use definite, specific concrete language - direct and to the point
- Write in a way that comes naturally - use your active voice
- Be clear - make it simple to read and understand
- Avoid fancy words
- Do not take shortcuts at the cost of clarity
Tips on writing blog posts : https://problogger.com/how-to-write-great-blog-content/ and http://www.socialmediaexaminer.com/26-tips-for-writing-great-blog-posts/
2.3.2 White papers
Where do you start with a white paper and what are they? White papers are originally documents written for government policies however this is most recently being used by companies and universities to get new policies and research into the public space.
There are some things to consider when writing a white paper:
- Pick a topic people will want to read or a problem you want to solve
- Pick a generic title that describes the problem at hand
- Engage, inform and convince your reader
- Be descriptive and professional
- Consider the audience you are ‘speaking’ to and accommodate for their level of expertise
- Set up a great intro
- Emphasize the value you want to or will create
- Decide on a length for the white paper (1-5 pages are the norm)
- Describe the solution you are proposing
- Remember a summary that reviews the problem, solution and result of the outcome
- Proofread your document, and ensure someone else reads it before you submit/publish it.
- Follow the 3-30-3 rule ( you have three seconds to captures your audience’s attention from a glance at your piece, if you succeed at capturing their attention then you have 30 more seconds to ensure they continue reading, if you pass the 3-30 rules then your reader will give you three more minutes to make your point).
If you would like to enhance your academic writing skills, you might be interested in have a look at the Academic Phrase Bank: http://www.phrasebank.manchester.ac.uk/
2.3.3 Assessments
The majority of your information regarding a subject and the assessments is contained in your subject outline. This is your base document and you should follow it closely. In addition you will get an assignment brief for each assignment you have due. Its is recommended that you review these briefs and that you follow the detailed instructions set out for you.
2.4 Research & Library Access
Research is something you will do a lot throughout your studies. There are many contexts that will shape the way you research. For the purposes of finding academic peer reviewed sources, some tips below will likely come in very handy.
The Library ( http://www.lib.uts.edu.au) has great resources, workshops and tools that will help you during your education if you choose to utilise them.
If you need some help understanding how to use the library, they have produced some short videos to help you get started: http://www.lib.uts.edu.au/headsup
![]()
The library website has an entire section dedicated to research: http://www.lib.uts.edu.au/research
There is also some self paced training modules you can do to help you get the most of what the library can offer for your research. http://www.lib.uts.edu.au/headsup-researchers
2.4.1 Searching the catalogue
One of the great things about the library catalogue is that it returns results far beyond the resources held by the library itself. UTS pay subscription fees to many 3rd party resources including journals, publishers and more. The best thing about this is that if you find something that has an online source available, you will likely be able to download a copy to your computer for later reading.
As an example, the link below will take you some search results for the term “Data science” and was then filtered to only show ‘online’ resources.
http://find.lib.uts.edu.au/search?Ntx=matchallpartial&Ntk=All&N=4294967183&Ntt=data%20science
If you click on the ‘Available’ link underneath each resource, it will then offer you the option of launching the electronic resource.
2.4.2 Databases & Articles
If you prefer to search specific sources, you can browse the databases section for 3rd party providers. This includes sources that UTS subscriptions that allow you access as a student.
Similarly if you wish to focus your search for specific journal articles rather than journals or books, the ‘Articles’ button is a great place to go.
2.4.3 Referencing

It is really important that you get used to referencing from the start. UTS uses the Harvard Referencing style. Fortunately there is an interactive referencing guide available through the library to make things easier:
http://www.lib.uts.edu.au/help/referencing
Make sure to browse through some of the other links at the above link. You might find some other useful tips (tools).
Some online tools that can help with citing include:
2.4.4 Library events & tours
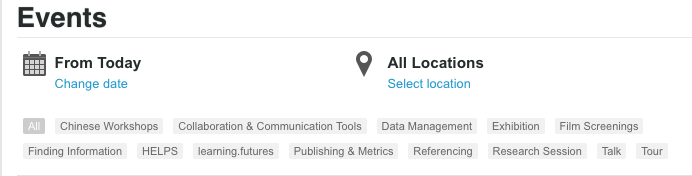
The library team will help you wherever they can. It is recommended that you keep an eye out for all their events on http://www.lib.uts.edu.au/events
The following events, particularly for MDSI students, are coming up in the next month and below are links where you can register.
MDSI: Data Science Research and Referencing Tue, 14 March, 2017 10:00 AM to 11:30 AM This workshop is a practical introduction to advanced research skills and reference management tools, with a focus on data science. Laptops are recommended but not essential. Participation is open to MDSI students. A concurrent workshop will run if more than 24 participants register for this session. http://www.lib.uts.edu.au/event/609872/mdsi-data-science-research-and-referencing
MDSI: Library Tour and Scavenger Hunt Tue, 14 March, 2017 6:00 PM to 7:00 PM An interactive tour (it’s a scavenger hunt) of the UTS Library services and facilities for MDSI students. Meet in the Library foyer. https://www.lib.uts.edu.au/event/609880/mdsi-library-tour-and-scavenger-hunt
2.5 Professional Experience
Developing professional experience can be a hard task, particularly if you are new to the industry. Often companies are looking for industry experience, yet it is hard to get industry experience without getting a job in the first place. A real chicken and the egg conundrum. The following are just some of the areas that can help highlight your professional profile and increase your professional experience so that you can standout fom the crowd, even if you haven’t gotten “industry experience” just yet.
2.5.1 Professional Profile
Building a professional profile and portfolio can be an effective career building strategy for the new data scientist. You can start with LinkedIn, a popular social media platform for professionals. UTS has a range of helpful resources for getting started with professional profiles, including Lynda.com courses.
Some ways to increase your visibility and credibility as a data scientist can come from showcasing side projects and knowledge sharing through blogs. Contributions to open source projects in the GIT via the github community or volunteering time to stack overflow problems can also improve your professional prescence online.
Whilst LinkedIn can be used for connecting with people, LinkedIn is a great way to bring in more eyes to your achievements and capabilities. Many recruiters and companies will look through LinkedIn to find the next employee, and sometimes background checks also include checking Linked-In and Facebook profiles. Try to make sure your LinkedIn is relevant and highlights your key atrributes.
https://careerhub.uts.edu.au/students/resources/ has a linked in workbook to help you review your profile
2.5.2 Networking
Once of the advantages of studying the MDSI masters is the community. Getting involved in this community can allow you to meet like minded colleagues and potentially employers. There are a number of student leadership opportunities available as well including: - Student Rep - Student Ambassador - UTS Hatchery
The career hub also has resources for students on networking
- UTS careers website > Careers events
- Read UTS: Careers Blog > Networking as a job search strategy
- https://careerhub.uts.edu.au/students/ > Resources > Networking-Tips-for-Students.pdf
You are paying not only for the university coursework but the whole university experience, including services such as the Library and UTS Careers - use these resources to your advantage whilst you are hunting for work experience.
2.5.3 Developing skills
For those that are interested in further developing skills outside of MDSI there are plenty of online courses available to do so.
Online Courses
Udacity, Coursera, Kahn Academy, and Udemy are some great resources to tap into. Whilst for most of these there is either a subscription or a course payment to receive a certificate, a few of these courses are free to study from and it will help expand your knowledge which serves as a great addition to your resume. The faculty might even be able to setup Datacamp login’s for students, check out #mdsi_datacamp in Slack for more details.
Datacamp
Whilst this technically doesn’t count as industry experience it is always good to get some online training through Datacamp. There are more and more courses being made available, and it will give you a taste of different languages currently used in the industry.
Kaggle Competitions & Hackathons
Often participating in Kaggle competitions or hackathons are great ways to develop experience and understanding of different data challenges which will help when finding that Data Science job. Whether you win a prize or not, the experience will help build your profile and give you the opportunity to try new skill or find those that you want to improved.
Github Or Bitbucket
Another way to demonstrate your experience is through Github or Bitbucket. Having code publicly available will allow companies to have an understanding of what you have learnt, or practiced on. Sometimes recruiters like to lurk on Github repositories to identify talent so keep a good copy of your code available for others to read.
2.5.4 Preparing for Your Job Search
Do you need some advice on your career or help with your CV/Resume? Here are some resources to prepare yourself for the task ahead.
Career Services at UTS
Checkout or contact career services:
- www.careers.uts.edu.au
- email: career@uts.edu.au
Also have a look at CareerHub for resources to help with your career plans or someone to talk to for advice.
Resources for increasing application success rate
UTS Careers Hosts throughout the year, multiple career workshops designed to improve employablilty and they come with resources: bity.ly/UTSCareersResumeWriting
Self Assessment Resources
- AbIntegro > log into UTS Career Hub > Resources > Search for the keywords ‘Career Assessments’
- www.careers.uts.edu.au > Career Planning > Self-assessment
2.5.5 Job Postings
So you have developed your skills, have your CV ready to go, and you are ready to take the industry by storm. Here are some locations you can look to find that new job.
At times Industry will approach CIC for students who might be interested in internships. These used to be posted by the CIC:MDSI team in CICAround, however whenever these possibilities come up, they now tend to be announced in the announcement section of the MDSI slack channel (#mdsi_announcements). MDSI Slack has the largest community of current students, teachers and alumni - so it make sense why this has become the new job posting channel (see below).
There are other channels within UTS that can lead to jobs. UTS has its own careers advisors who host the UTS career hub. You can sign up to newsletters for helpful blog posts with career related advice.
For current students you can register your details to StudentJobs@UTS for on campus jobs.
Student Targeted Job Boards
- UTS Career Hub
- unigrad.com.au
- au.gradconnection.com
- seek.com.au/graduate-jobs
- linkedin.com/studentjobs
Slack
On occasion job opportunities can be posted into the MDSI Slack channels so keep your eyes open for them. The main channels which contain job postings are:
iLab 1 & 2
As iLab’s are a core component of the MDSI course, it is important to maximise the opportunity when it is available to you. Whilst not every iLab will lead to a permanent job later, it is a great opportunity to understand what areas might be useful to develop and build upon. It will also look good on your CV, demonstrating the learning and the achievements you have made in your iLabs.
2.6 Data Security
Include a security/privacy sub section (must cover concepts of masking, encrypting etc data)
Data security is defined as measures that is used to protect digital privacy as to prevent unauthorised access to computers, databases, websites and other digital items. It also protects data from corruption.
Data security can include backups, data masking, encryption or even data erasure.
Data masking is defined as the process of changing certain part of data so that the structure remains the same but the information itself is changed to protect sensitive information. It ensures that sensitive information is unavailable beyond the permitted environment. It ensures that the original values are not re-engineered or identified. Eg is user training and software testing.
Data encryption ensures that data is unreadable to users who are not authorised to access the data and who do not have the ‘key’.
One of the most common ways of securing data is using authentication like passwords, and other data that can verify an identity ( like email and password login) prior to granting access to a system. These measures are taken to ensure hackers that use alternative system access methods to sabotage computer systems and networks.
Hacker actions can be illegal or legal depending on the purpose behind the actions. There are three categories of hackers :
- Black hat hackers break into computer systems illegally and cause harm by stealing or destroying data, i.e., a banking system to steal money for personal gain.
- White hat hackers use their skills to help enterprises create robust computer systems.
- Grey hat hackers perform illegal hacking activities to show off their skills, rather than to achieve personal gain.
10 General Data Security Tips:
- Back up early and often
- Use file-level and share-level security
- Password protect documents
- Use EFS encryption
- Use disk encryption
- Use a public key infrastructure
- Hide data
- Protect data in transit
- Secure wireless transmission
- Use management or access control
Types of Encryption:
- Triple DES : It uses three individual keys with 56 bits each that adds up to 168 bits. This is a dependable hardware encryption solution
- RSA : A public-key encryption algorithm and is standard for encrypting data over the internet. Is a asymmetric algorithm due to use of a pair of keys. There is a public key, to encrypt, and a private key, used to decrypt.
- Blowfish : the symmetric cipher splits messages into blocks of 64 bits and encrypts them individually. Its high speed and very effective. It’s also free source software.
- Twofish : Symmetric algorithm with keys up to 256 bits, only one key is needed. The fastest of its kind and ideal for hardware and software. It’s also free source software.
- AES : Most trusted algorithm by U.S. Government. Has an efficient 128-bit but also a 192 and 256 bit algorithms for heavy duty encryption purposes. Considered impervious to attacks except brute force.
- Honey Encryption : deters hackers by serving fake data for every incorrect guess. It slows down attackers but also provides a haystack of false hopes and makes it difficult for hackers to find the correct key.
http://www.computerworld.com/article/2546352/data-center/top-10-ways-to-secure-your-stored-data.html
http://www8.hp.com/us/en/software-solutions/what-is/data-security.html
http://www.lexisnexis.com.au/en-au/products/privacy-confidentiality-and-data-security.page
2.7 Hackathons
Hackathons are competitions (socially or sometimes for a prize) that challenge you with a goal or a problem. In a data science context this typically involves datasets and your wits against a clock. Hackathons are a fantastic way to learn from each other, to ideate, validate, develop your skills and sometimes even build a prototype. Hackathons are one of the most authentic learning experiences you can have as a data science student. You will practice all sorts of skills you need to become amazing:
- Team work
- How to frame a problem
- Data investigation
- Practicing and learning all kinds of technical skills
- Data storytelling
- Presentation & selling your ideas
- Networking
Hackathons are educational, engaging and empowering. You do not need to feel ready before you participate. The only thing you need to do is show up, have a positive ‘can do’ attitude and have fun.
They last anything from a few hours to a few days.
MDSI students have been leaving their mark at these events by taking home the prizes as well as the really big prize checks as can be seen on display in CIC.
The most popular one to get involved in is ‘Unearthed’: http://unearthed.solutions/ Our very own ‘Data Cake’ took home the first prize in 2016, ‘Perry’s Fan Club’ took home shared second prize in 2016 as well as ‘Team Beaver’ taking home Young Innovator Award.
If you don’t want to wait for an event and want to sink your teeth into a hackathon right now, you can participate in online data science competitions. Here are a few links to get your started:
- Kaggle https://www.kaggle.com/
- DrivenData https://www.drivendata.org
- InnoCentive https://www.innocentive.com/ar/challenge/browse
A list of hackathons updated weekly : http://disruptorshandbook.com/big-list-hackathons/ Another good source of hackathons : http://www.hackathonsaustralia.com/
2.8 The art of ‘self learning’
Self learning is the process of teaching ‘self’. With the boom in freely available technology it has become possible for each student to dictate their own learning experience and how much they want to expand. They can either learn the minimum of what is being taught in class, or they can put in extra time and work and participate in the exciting adventure of self learning.
This involves using various resources from YouTube, Journals, Additional Books and anything else you can get your hands on that adds to your skillset and your knowledge base.
In recent days self learning is considered an art with lecturers there as guidance or mentors on this journey where you can develop your skills to great depth in a short amount of time.
There are a few things to keep in mind during this journey :
- Reputable sources for learning a concept is required. If you plan to embark on the art of self learning you need to make sure that the sources you are learning from, know what they are talking about. What can be considered reputable sources?
- Academic journals or white papers
- Non- biased sources
- Generally, personal blogs are avoided. However, in this constantly updating space we might need to learn from other expert in the field that explain these fast changing concepts.
- Read textbooks and books about the topic. A large collection of books are available to you as a student for free via the Library (you can sometimes even download a pdf version for your personal use).
- Watch the videos on YouTube on the topic, especially for the more tricky, hands on or mathematical based subjects.
- Learn from your surroundings. Never underestimate the value others can bring to your journey. This ranges from mentors to other students, some students are further in their journey and can help you along. There are also various meet-ups and networking events surrounding these topics.
- Hands-on experience is by far the best. Join a hackathon, or get an internship.
- Use guided learning experiences, like MOOC’s on Coursera or a range of other platforms.
- Plan your success. Write down your goals, learning outcomes and what you would like to master or be able to do and endeavour to move toward those goals (this will be really handy in iLab too).
2.9 Resources and learning
Online short courses:
- Lynda.com : you have free membership via the Library which gives you access to all the courses, https://www.lib.uts.edu.au/goto?url=https://shib.lynda.com/Shibboleth.sso/InCommon?providerId=https://aaf-login.uts.edu.au/idp/shibboleth
- Coursera : membership is free, https://www.coursera.org/
- DataCamp : you have free membership via MDSI which gives you access to all the courses, https://www.datacamp.com/, once you join ask to join MDSI group and the courses open up.
Online Books:
- R for Data Science by Garrett Grolemund and Hadley Wickham - http://r4ds.had.co.nz/
- Applied Predictive Modelling by Max Kuhn - available via the library https://link-springer-com.ezproxy.lib.uts.edu.au/book/10.1007%2F978-1-4614-6849-3 (requires login with yoru student ID and password)
- Python Data Science by Jake VanderPlas https://github.com/jakevdp/PythonDataScienceHandbook
Github repositories with great links:
- Free programming books https://github.com/vhf/free-programming-books/blob/master/free-programming-books.md#python
- Python Data Science tutorials: https://github.com/ujjwalkarn/DataSciencePython
- R Data Science tutorials: https://github.com/ujjwalkarn/DataScienceR
- Machine learning & Deep learning tutorials: https://github.com/ujjwalkarn/Machine-Learning-Tutorials/blob/master/README.md
- Some more Github resources and corners of the web to explore: https://www.analyticsvidhya.com/blog/2016/09/most-active-data-scientists-free-books-notebooks-tutorials-on-github/
2.10 iLabs!
The MDSI program involves two iLab courses - appropriately termed iLab1 and iLab2. Each of these courses is 12 credit points - which is huge. An iLab is basically a ‘real life’ data science project, usually undertaken with an industry partner.
2.10.1 Setting learning goals
For both iLab1 and iLab2, you will probably be required to set your own learning goals, against which you’ll be assessed. It can be helpful to do this in two steps. First, decide on some topics that you’re interested in learning more about. These might be topics that you consider your weak points (and hence you want to improve on them), or topics that you consider your strengths (and you’d like to further specialise in them), or a combination of both. Similarly, think about topics in terms of both soft skills and technical competencies. Is there an analytical technique you’d like to learn more about (image recognition, natural language processing, network analysis, etc)? Or a new technology (perhaps another programming language)? Do you want to work on your presentation style or storytelling visuals? Think also about your career goals - what are the gaps in knowledge/experience between where you are now, and where you want to be next.
The second step is to actually draft up learning goals for each of your chosen topics. The learning goals will each consist of a goal (‘assessment criteria’), and one or more (measureable) actions, deliverables or outcomes (‘identified elements’). There is a lot of information online about goal-setting; for example, look up SMART goals or OKRs for guidance.
Many students are concerned about setting themselves up to fail by choosing goals that are overly ambitious. It can be tempting to define scope narrowly so that you can be sure to achieve what you intended. Remember, though, that iLabs are all about learning. If you’re certain you’re going to reach your learning goals, you may not be stretching yourself as much as you could. That said, you might choose to have a mix of ‘stretch’ and ‘readily achieveable’ goals, so that you can build momentum with the achievable goals.
Note also that you can (via agreement with your mentor) change your learning goals throughout the semester. If you find yourself needing to change your goals partway through semester (for example, because they were insufficiently challenging, unsuited to the actual project, or completely unachievable), this is itself useful material for reflection and learning.
2.10.2 Client communication
2.10.2.1 4 reasons to spend significant effort on getting this right:
Clear and regular communication with your client will ensure that there are no misunderstandings: that you aren’t misinterpreting the data, or making poor assumptions, or heading entirely in the wrong direction from where they’d like to be heading.
Your iLab is not just about delivering what the client wants; it’s also about your own learning objectives. Your ability to shape the project to meet your own objectives will be determined by the level of communication you have with them, and to an extent by the level of trust that your communications build.
In the real world, projects are successful if the key stakeholders feel good about the results. The best way to ensure they feel good at the end - regardless of the actual quality of the result - is to actively manage their expectations so that there are no surprises along the way. This is the most important skill a project manager can have, and one that you should practice in your iLabs.
There are marks for it. The marking rubric explicitly includes references to effective communication and presentation of ideas, but underlying the whole project is the need to add value to your client organisation and without strong communication along the way it’s unlikely that you’ll be able to achieve that.
2.10.2.2 Present yourself like a consultant
They are your client, so act like a consultant not an intern. Make good use of formality, structure and documentation.
- Agree a regular meeting time so you don’t have to battle to get into people’s diaries.
- Don’t defer a meeting if theres little to discuss - unless absolutely nothing has happened since the last one! You never know what small detail in a brief update might lead to a revelation.
- Meetings that have written agendas tend to be more results-oriented.
- A handful of simple (but elegant) slides can make a huge difference to the impression you give and the engagement and results you can drive from a discussion.
- Use video conferencing if distance or travel is a problem. Slack video calls and screen sharing are fantastic, and there are plenty of other platforms.
2.10.3 Time Management
Managing time involves identifying deliverables required by UTS and the project/employer and determining the activities associated with these deliverables and estimating effort, duration and dependancies. Once you do this in the beginning, soon you may realise that your scope is too large (in most cases). UTS deliverables are fixed but typically they are not too onerous however, the project deliverables may be more involved. The key is define what the MVS (minimum viable solution) is. If the MVS can be achieved with half the time allocated, that would be a good situation to be in. Additional deliverables can be negotiated as optionals and prioratised.
Typically, the iLab duration is a 12 week period. Although the semester can run longer, iLab presentations and other deliverables may be due early. Its best to work back from the due date which is typically the iLab presentation date. Client may have different timeframes but the iLab should fit into semester dates. Once you work back from the due date, you will get a better idea of the actual time you may have. If you allocate the last week for preparing presentations you only have about 11 weeks. This can be further broken down into requirements, design, build and delivery, following a waterfall model. You can choose an agile process but stakeholders may not be available for standups and etc. Within the waterfall model you can run weekly sprints. For example
| Week | Activity |
|---|---|
| 1 | Requirements Sprint 1 |
| 2 | Requirements Sprint 2 |
| 3 | Requirements Sprint 3 |
| 4 | Design Sprint 1 |
| 5 | Design Sprint 2 |
| 6 | Build Sprint 1 |
| 7 | Build Sprint 2 |
| 8 | Build Sprint 3 |
| 9 | Build Sprint 4 |
| 10 | Build Sprint 5 |
| 11 | Deliver Sprint 1 |
| 12 | Deliver Sprint 2 |
Each week, you should have a catch up with client and should have something to show like sprint goal. Once you make a plan similar to above, you will get a better understanding on how you can manage your time and what you can achieve in the timeframe. If you can plan to build the MVS by week 6/7 that will be best outcome however, in order to do this you will need to lock in requirements a lot earlier which may be challenging. You should also set “drop dead” dates where by a certain date you must lock in requirements otherwise you will not be able to hit the deadline.
2.10.4 Pitching and Storytelling
One of the most powerful areas of data science is the ability to tell a good story with the data and the results.
The MDSI program has two iLabs, which requires students to take on an industry problem, work on it and present back to the business. The problems put forward by industry can range from data exploration exerises and data visualisation to predictive modelling. However, no matter the problem being worked on, good pitching and storytelling is a critical part of the solution. This can also be seen in hackathons, where a good pitch can win first prize.
Part of developing a good story and pitch is first understanding the stakeholders and identifying:
- What drives them
- What motivates them
- What they need to make decisions
See the below example for one way of classifying stakeholders:
| Stakeholder type | Characteristics | Information needs | Decision-making style | Change | Conflict | |
|---|---|---|---|---|---|---|
| Expressive (values approval) | Ambitious, persuasive, talkative, charasmatic, generous, fun loving | Big picture summary, visual | Fast, based on past/gut | Open to change, if get quick win | Tackle head on | |
| Amiable (values harmony) | Easy going, diplomatic, good listener, people first, patient | Detailed, emotional, impact on people | Slow, consensus drawn | Closed to change, value tradition and stability | Avoid | |
| Driver (values outcomes) | Dominant, confident, determined, decisive, visionary | Bottom Line on Top | Fast, rational, bias for action | Open to change, if deliver results | Tackle head on, but don’t like to admit they’re wrong! | |
| Analytical (values correctness) | Detailed, disciplines, cautious, listening for information/facts, talking by explaining | Detailed, needs lots. Dependent on facts and data, structured and logical | Slow, rational, process driven | Closed to change, too risky | Avoid (avoid people!) |
Throughout the iLab, students will work closely with an industry group. The types of stakeholders may include:
- Technical data scientists
- Data Engineers
- IT specialists
- Marketing and sales
- Business development managers
- Managers
- Directors
Students will work with a range of the above stakeholders to:
- Understand user requirements
- Iterate solution design
- Obtain data and construct the construct the right envronment to work in
- Conduct user acceptance testing
- Provide project status updates
- Highlight risks or issues
Depending on the stakeholders and the type of conversations/meetings taking place, language and content needs to be tailored for the most effectively communication.
To influence decision making and to convince the right people to adopt the final solution, the most appropriate style of communication needs to be chosen.
Influencing skills therefore helps get results which meets the legitmate needs of all stakeholders.
 Below are some top tips when developing a pitch:
- Keep the pitch short, sharp and concise
- Know your stakeholders and what drives them
- Tailor your language and content
Another part of storytelling is using data to tell the story, this include designing the visualisation or dashboard to tell the right story. The following website provides a good starting point: https://medium.com/plotly/maximizing-the-data-ink-ratio-in-dashboards-and-slide-deck-7887f7c1fab
2.10.5 Data Privacy
Its important to address data privacy in the early stages of your iLab project to ensure you don’t run into problems later on.
The client will likely require you to sign a Non-Disclosure Agreement (NDA) that addresses the contractual obligations regarding intellectual property rights, ownership and data handling requirements to name a few. This is normal and is something that is usually required when engaging with and providing services for a client as a data science practitioner or consultant. Further to this it’s important to understand the scope and detail of the NDA, if you have issues with certain aspects of it or don’t understand it then please seek clarity from your client or discuss it with the iLab subject coordinator.
Once these formalities are complete it still may be some time before you get your hands on the data, during this time you should speak with your client about the environment in which you will be accessing the data. For example, will this be through a cloud based solution such as AWS or equivalent and is this something the client will set up for you. If your client is ok with you having a copy of the data locally then what measures or controls do you have in place to ensure you keep the data secure? Controls could include password protection, secure network access and having an operating system with up-to-date security patches.
Under no circumstances should you upload client data to third party servers without prior consent from the client, doing so could put your client’s data at risk of being compromised. Should a data leak occur it can have severe consequences for the client including reputational damage, brand deterioration and financial impact. You should also familiarise yourself with the organisation’s values statement if one exists and keep these values in mind throughout the duration of your project.
When you do get access to the data you should check there is no personal information present that can be used to identify someone such as names, phone numbers or addresses. If you find something questionable its important you flag this with the client and seek assurance that this data point was intentionally shared and not included by accident. It’s important the client is aware of everything they have shared with you and aknowledge any risks associated with the data shared.
Finally, keep in mind the ethical implications of your work as a data scientist, especially as scope, objectives and data can change at any time.